


Investing for growth
Why Early-stage Revenue Leaders should be obsessed with margins and cashflow


Paros, Greece
A picture may be worth a thousand words, but a number can summarize a thousand stories.
When I begin working with a Seed or Series A startup, there are a few things I like to learn from the Founder. And on that list is one item often overlooked by Revenue Leaders - the financial metrics of the business, specifically: 1) Margin structure, 2) Cost of acquiring a new customer/$1 in revenue, 3) Cash on hand and burn rate.
For some reason, many Sales Leaders leave “Finance” to the Finance team, but if you’ve ever run a P+L before, you know it’s best to have a firm grasp on the financial metrics of the business so you can 1) strategically allocate resources to grow the business and 2) properly view investments through the lens of the entire company versus just your Org.
Put bluntly; some Sales Leaders have zero credibility with their CEO and CFO because they are always “pounding the table” for more resources without understanding the simple margin structure of the business and the larger goal and path of working towards an Operating Profit. Don’t be like them.
Conversely, the CEO and CFO need a dynamic Sales Leader who thoughtfully weighs where to invest resources and shares balanced feedback on how best to hit revenue targets.
Here is some advice on where to get started.
Step One - Uncover Your Metrics
Let’s start with the basic margin structure. A startup can break down its expenses into Sales & Marketing, Research & Development, and General and Administrative. For a SaaS company, the costs of its sales team, marketing team, and paid marketing roll into S+M, Product, Eng, and related expenses (Hosting) roll into R+D, and things like Recruiting and HR roll into G+A.
Some Examples:
Top Quartile Metrics from Openview’s 2021 Financial and Operating Metrics Benchmark Report

Median spend benchmarks (% of ARR) from SaaS Capital’s 2022 Spending Benchmarks for Private B2B SaaS Companies

Before I can help a startup put together a revenue growth plan and scale its sales team, I want to understand two metrics: 1) How much does it cost to acquire a new $1 in revenue? and 2) What % of total revenue in a given month/quarter is going toward Sales & Marketing Expenses?
I never assume a startup’s margins look like the charts above. On metric #1 - less than two years ago, when the market was frothy, many startups were spending 100% or more of each new dollar of ARR on Sales and Marketing to acquire that new customer/$1 in revenue. That means they aren’t seeing any operating profit from that customer until month 13 or more. All the cash goes out the door when acquiring the customer to marketing spend, salaries, and commissions. And to make it worse, the revenue isn't seen upfront for recurring revenue models (most SaaS and Marketplace startups). It’s paid out monthly.
In fact, you can see the CAC at 20+ months in some examples on chart #1 (keep in mind this is data from high-growth companies with substantial funding in 2021).
We’ll take a look at some examples in the next section.
On metric #2 - you are looking at overall Sales and Marketing Spend, not just costs attributed to acquiring a new customer. It's critical to understand overall spending for a few reasons.
If the business is brand new and has no existing customer base, it will burn through cash acquiring customers without a base of existing customers to pad the bank account.
Conversely, if the business has been acquiring and retaining customers for a year +, you could “fund” the acquisition of new customers through the profits of your existing base. Retention and profitability are vital to understanding your levers.
The lifetime value of a customer determines profitability in the out years. Low lifetime value means fewer dollars to fund un-profitable customer acquisition in year one.
In Marketplace businesses, you have costs on the supply and demand side. Ideally, one side of the marketplace is cheaper to acquire than the other, and this can help fund acquisition costs on the other side. Either way, you want to look at all Sales + Marketing costs for supply and demand against total revenue generated from the marketplace to get a true sense of your unit economics.
Lastly, costs associated with metric #1 (acquiring a new customer) can be subjective for many startups. It may not give a full view of the cash available to invest in revenue growth. For example, if acquiring a new customer involves customer success running onboarding and account management in year #1, that will need to scale as new customer acquisition scales (unless you change something). Or maybe you attend conferences every quarter that drive important new customer leads. Expenses beyond sales teams and paid marketing may not be included in “customer acquisition costs.” Looking at everything that can be considered Sales and Marketing against total revenue ensures you don’t miss something.
As you can see, a good general benchmark to work towards is 50% or less in total Sales and Marketing spend. This may be much more or much less in the early days of a startup’s journey. But keep the destination in mind.
Step Two - Forecast Your Growth
Let’s examine how our margins, acquisition costs, and payback periods impact growth plans.
Let’s say Startup A has built a hiring platform for SMBs to hire new employees. The average new customer spends $500 monthly on the platform (est. $6K in annual revenue), and the average Salesperson brings in 4 new customers monthly— $24,000 in yearly revenue.
The average annual OTE for a salesperson is set at $100,000 for signing four new customers per month. Monthly commissions are paid upfront after the customer signs.
On its surface, we are investing $100,000 per year for $288,000 in expected revenue. This seems OK, with roughly a 34% simplified Cost of Sale (COS). Assuming the salespeople are hitting their numbers, this could be scalable for an early-stage company.
Let’s put together a couple of possible forecasts and look at how things can deviate from our simplified COS.
1) Cashflow
If commissions are paid upfront, but revenue is recognized monthly, you’ll want to examine the company's cash flow closely.
You may have “productive” salespeople signing contracts worth much more than they are paid in compensation, but they may not be “profitable” from a cash flow perspective for many months.
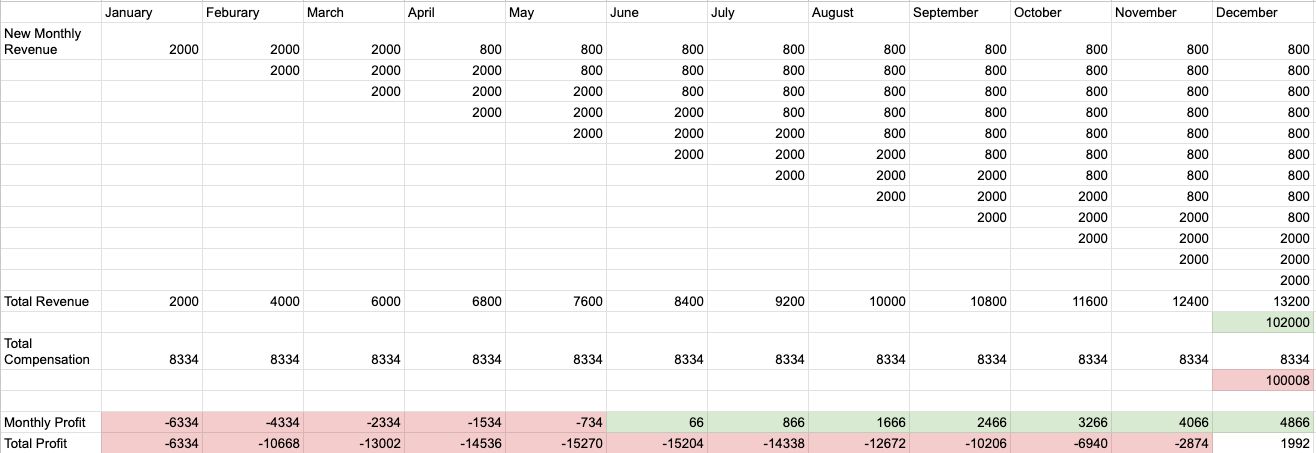
This table outlines the monthly profits generated by a salesperson at Startup A.

As you can see, the Salesperson isn’t profitable to the company until their eighth month on the job, despite hitting their number each month. This doesn’t account for a ramp-up period (typically 3-6 months for a new salesperson) and other costs outside of compensation (benefits, equipment, travel, management, etc.) These factors will push out profitability even further.
This is one reason why many SaaS companies offer a substantial discount for paying for a year upfront.
2) LTV of a customer
Let’s look at a different forecast that assumes that in the early days of the startup, the monthly revenue from a customer was consistent at $500 per month, but in the past couple of quarters, the sales team has been expanding into new markets, which is affecting the monthly revenue from new customers. It used to be $500 per month, but let’s assume we see monthly revenue drop to $200 per month after the first quarter because the customer’s perceived need for the product decreases.
Instead of $6,000 in expected annual revenue per customer, we are seeing $3,300. But we are still paying a commission based on $6,000 in expected annual revenue. This drastically shifts our margins for acquiring customers.
Let’s see how this impacts our profitability.
As you can see, profitability on a per-salesperson basis is pushed out to month 12.
So what do we do? As the company misses top-line revenue targets, an inexperienced Sales Leader may push for hiring more people or investing more in Marketing. Both are additional investments that could hurt our unit economics even further. Instead, we must ensure we get our unit economics right before hiring more people. This may include re-aligning the sales team to spend more time on onboarding and engagement in a customer’s first six months to drive up spend. The Product team could also drive this outcome. Or maybe we re-focus our team on more mature markets that deliver consistent monthly revenue.
There are endless possibilities. The challenge of any Sales Leader at a startup is maintaining a healthy paranoia about what could go wrong and investing strategically to ensure the team maintains productivity.
As an aside, this can work in the opposite direction. As a product becomes more valuable or a marketplace more liquid, monthly revenue can increase in the out months, thus improving cash flows and profitability.
In the early days of a startup, you should expect customer lifetime revenue to change, so you’ll want to forecast various scenarios and understand where the model is sensitive. From there, closely track monthly cohorts of new customers to see when things begin to deviate.
Hiring new salespeople, moving into new markets, selling to different types of customers, and launching new products can all quickly impact monthly productivity. Don’t be surprised when they do. Have a plan B and a plan C.
Step Three - Cash is King
Building and scaling a sales team, even a profitable one, is always an investment. When I sit down with Founders and look at scaling a team, I always calculate incremental salespeople’s monthly all-in costs and multiply them by six to understand the overall investment in the coming two quarters, setting aside any revenue targets.
If a Salesperson costs $12K per month all in, and we are going to hire four new people, that is $48K per month. Multiplied by six months, we are looking at $288K. What must we see at months one, three, and six to evaluate this investment? What is the path to each Salesperson being profitable? How long will it take to get a 2x1 return on each dollar invested in the sales team? 3x1? How do different ramp-up times, productivity, and revenue retention affect the forecast?
Most startups are balancing their cash on hand vs. their current burn rate. By understanding these metrics and viewing everything as an investment, the Revenue Leader can help to develop a plan that maximizes revenue while ensuring key operating metrics don’t become unsustainable.
Put simply, for startups, cash is king. The revenue leader must carefully balance cash in the bank, current burn rate, and investment for growth. The revenue plan must not only deliver a return on investment but also not create an unsustainable burn rate in the short term.
Don’t get me wrong, when I say a Revenue Leader should be obsessed with margins that doesn’t mean pushing for cuts as the default move in a blind attempt to drive down costs. It means being obsessed with building a margin structure that delivers operating profit so you can invest in growth for the future. Seeking to build a solid margin structure that empowers you to invest aggressively with confidence and lean into healthy investments when you see them working— without having your hands tied by a core model that is unsustainable.
In the past couple of years, too many startups conflated “choosing to be un-profitable” with “unprofitable.” Great startups, at their core, have great business models, with unit economics that scale and areas in which to invest that deliver sustainable ROI.
Great startups will strategically “choose to be un-profitable” to deliver breakout growth in a 3-5 year period. But they will keep their fundamentals in line while deliberately investing aggressively in areas with proven ROI.
This approach doesn’t happen overnight; if you are early in your journey, don’t overthink it. Begin by uncovering your metrics, forecasting your investments, and tracking the impact on cash flows. It is a muscle that startups build over time.
Good luck out there,
Pete
Pete Hancock is the Principal of Hancock Consulting, where he partners with Seed-Series B startups to accelerate revenue, develop go-to-market strategy, and build & scale sales teams. For more info: petehancock.me